Alerting on Resources Utilization
Our applications will inherently have some limits, for instance, memory (RAM) or disk and it will probably be useful to alert in case, disk reaches 80% capacity. For this, use-case we use Prometheus (opens in a new tab) data source that captures these metrics for individual instance spined up in our cluster.
The easiest way to create a alert on resource utilization is to visit any of our Grafana dashboard, that contains information you want to alert on. We recommend Pod Dashboard (opens in a new tab), in case of alerting on app/pod/container and will use it in following example: Alert on application high memory utilization.
So, to setup an alert, let's say bratislava-next-app on prod cluster, when reaches 90% memory utilization, we need to
-
Set the filters, on top of the page to the desired output. In our case it would be

-
Choose the panel that contains the information that we want alert on. Click on the name of the panel and hit
"edit"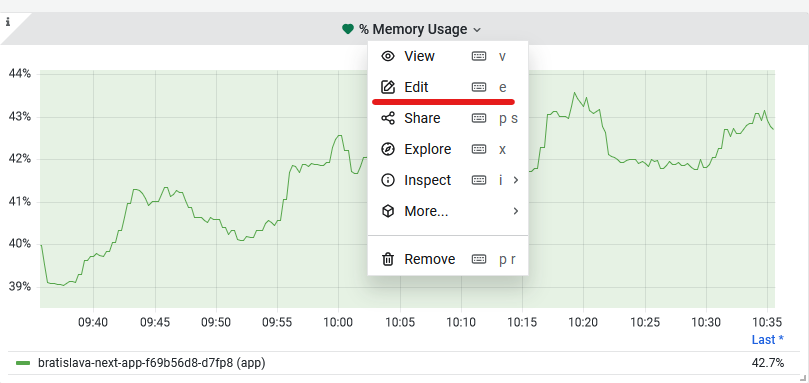
-
There, you will see already prepared query, that will contain your information (cluster, pod, etc.). Select "Alert" in the menu
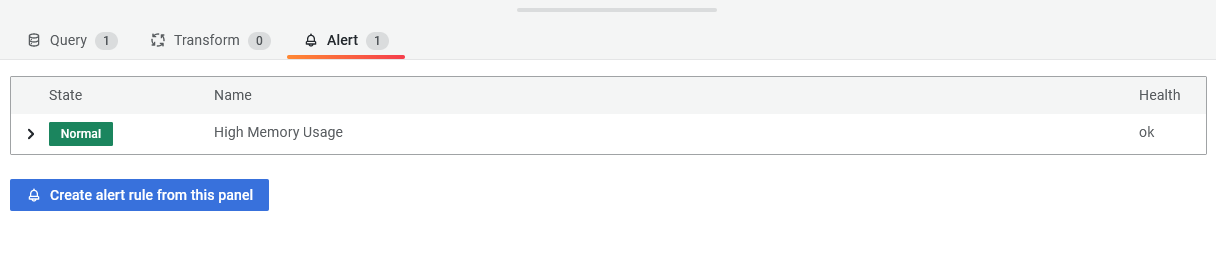
-
Now, you should see all existing alerts tied to the panel/chart. Hit the "Create alert rule from this panel" button
-
If you get a message saying, to save the dashboard, hit <font color="white" style={{backgroundColor: '#e02248', padding: '2px'}}>Discard
This will open up a alert UI, where your query should be already filled in, with correct values from your filters.
You can skip steps above if you know Prometheus query language (opens in a new tab) and just go directly to this UI through alert button in the left menu (bell icon) and fill in the query by your self.
-
Fill in the values, for
Rule name, give it what ever you feel is descriptiveFolder, select based on the clusterGroup, you can put anything in place of a group, like project name
Bear in mind that all alerts within the same group will be evaluated at the same time. So, if you are planing on creating more alerts for one project, we would suggest to give it the name of that project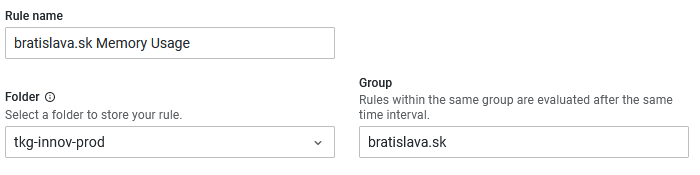
-
Now, we need to construct the alert expression. There should be already a expression called
A, with selectedOperationfield "Classic condition". Let's change that to "Reduce" from the drop down menu -
As
Functionlet's put "Last" and asInputselect the query name above. This reduces the entire series only to the last know value. You can also choose, what to do with missing values, for example, replace them with another specific value or keep them asNaN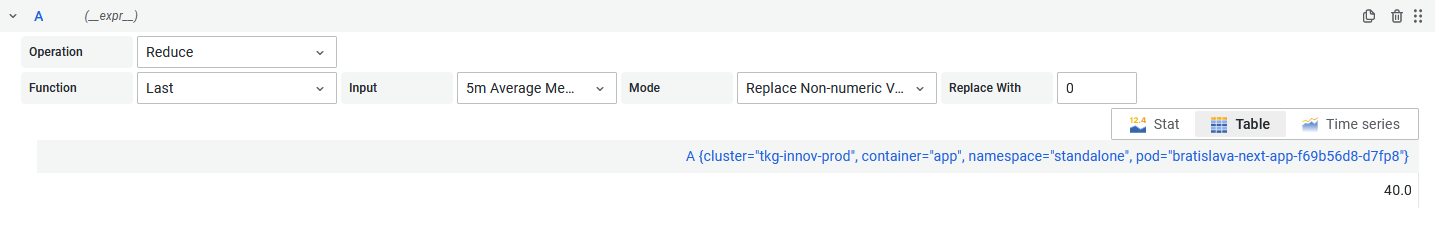
-
Click "+ Expression" button
-
This should create a
Bexpression. Let's select asOperation, option "Math", which will create a big text box where you can write math expression (opens in a new tab) -
You can use the query names as variables, so in our case we want to evaluate when expression
$Ais higher or equal to 90. Therefore, we write$A >= 90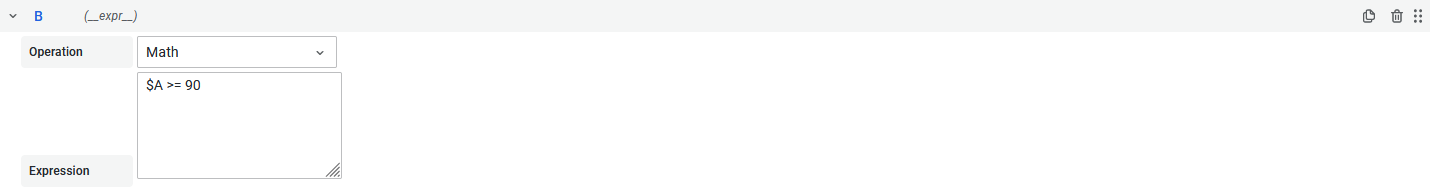
That is almost it, we only need to setup alert condition.
-
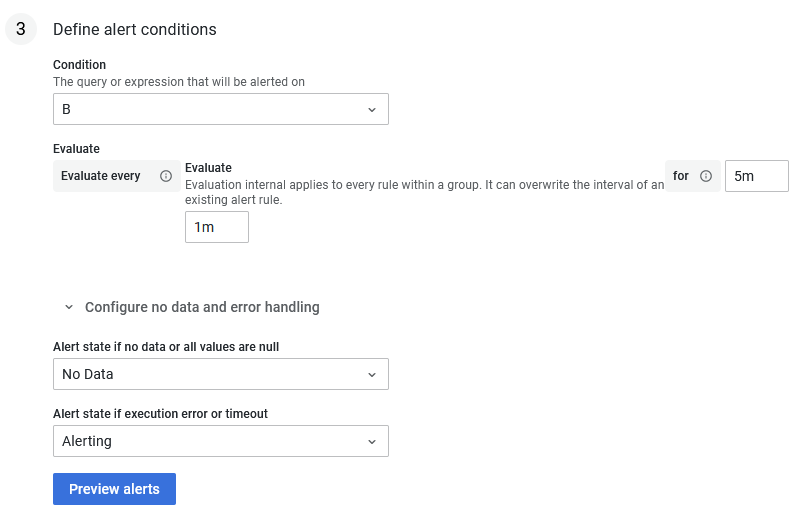
In a
Conditionfield, we need to pick our "Math" expression name, in our case "B" -
Choose evaluation interval and for how long we want the alert to be in a "Pending" state before it starts firing
If you are wondering where this is useful, it might be that in some case you have very volatile metric, like CPU utilization. This can go rapidly up and then in a minute go again down to normal levels. You might not want alert every time this happens, but put the alert in a "Pending" state and check latter if the metric is still in breach of the condition or it is back "Normal" -
You can also select what you want to do in case of missing data
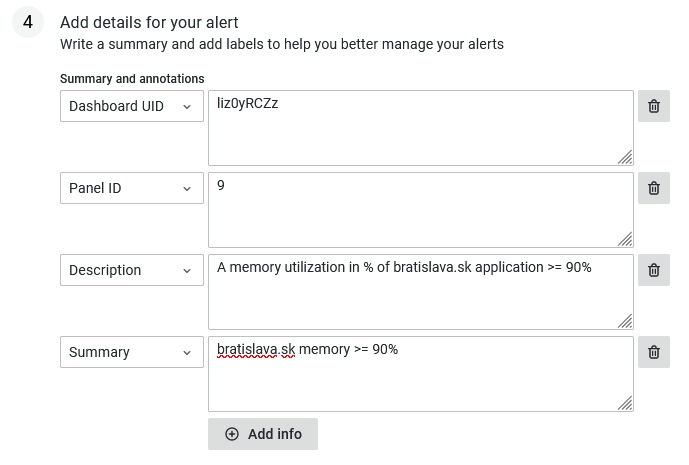
Now, we are done with the alert and you can <font color="white" style={{backgroundColor: '#3871dc', padding: '2px'}}>"Save and exit", and the alert would start running. But it might be beneficial to put some more information about it. You can do it the next section and put there some Description and Summary.
Also, put some other specific labels, which you can also then use to specify in a contact point to target your alerts. Something like
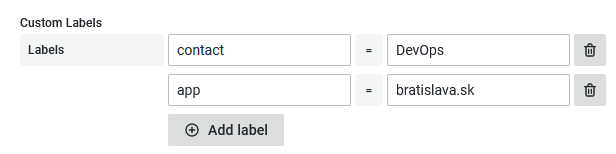
Note, that by default any labels from your query will be also assign to your alert, for instance, stuff like app, pod, cluster, etc. You can use these as variables in your summary and description through templates (opens in a new tab). This is useful when your query encapsulates multiple applications, you can use these variables to specify for which application the alert if firing.
And that is it. Now you can just <font color="white" style={{backgroundColor: '#3871dc', padding: '2px'}}>"Save and exit", and your alert should be running, and firing in case of any issues.
The default contact point is through Slack to grafana-alerting channel. If you want to receive your alerts somewhere else or through some other means, please checkout "How to add Contact Point" recipe.
Examples
You can take a look on following examples of application and kubernetes node resource alerting
- Prometheus alert (opens in a new tab) on application resources. It checks all deployed application on prod cluster if their long term memory usage is >= 90%
- Prometheus alert (opens in a new tab) on kubernetes node resources. Checks long term memory usage of kubernetes worker nodes, if their utilization is >= 90%